

TL;DR
- Sales productivity statistics show RevOps and Compensation leaders where rep time leaks and where quotas miss the mark. They also flag the incentive changes that lift revenue.
- Spot productivity leaks with selling-time data and quota trends.
- Compare your team against 2025 and 2026 sales productivity data.
- Track cycle length and win rates to diagnose friction across the pipeline.
- Connect productivity data with compensation visibility so reps see which deals drive earnings.
Every revenue leader carries one quiet worry: are my reps selling, or just staying busy? That worry rests on solid ground.
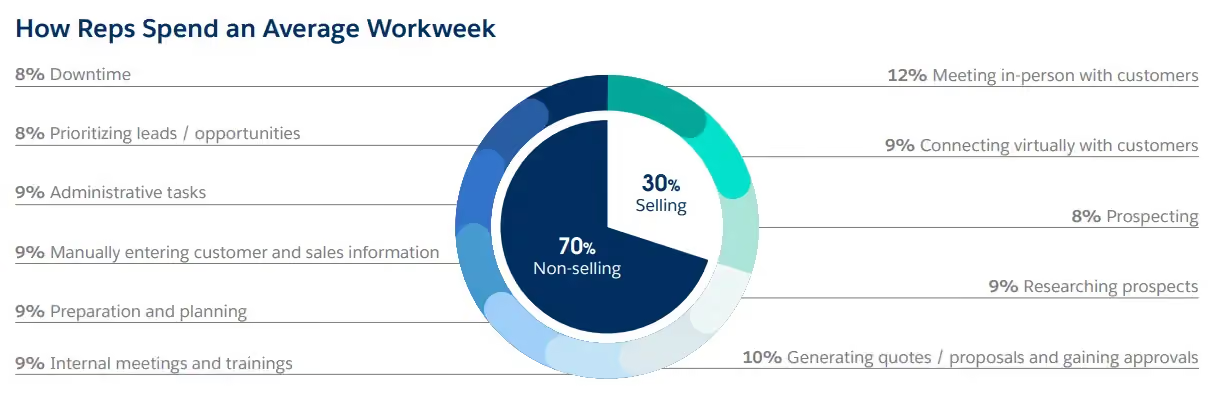
Several 2024 reports highlight a widening productivity gap. Reps spend only 30% of their time selling, while admin work and internal meetings consume the rest of their time.
For many teams, the problem extends past CRM admin and internal meetings to compensation complexity. When reps stay unclear on how deals translate into earnings, focus slips. When RevOps and Finance teams reconcile commissions in spreadsheets, productivity across the revenue engine drops.
I built this report to give you reliable, actionable sales productivity statistics for 2026, drawn from 2024 and 2025 data plus emerging 2026 trends. The goal goes past showing where reps lose time. It also shows where incentives and compensation visibility help teams convert effort into revenue. You'll see where reps lose the most time and which activities drive the biggest revenue impact.
By the end, you'll have the numbers and benchmarks to diagnose your team's performance and build a productivity system that scales.
If AI is part of your 2026 productivity strategy, use this report to benchmark how RevOps teams apply AI to forecasting and seller efficiency.
Top Sales Productivity Benchmarks for 2026
Five 2026 sales productivity benchmarks with sources and the reason each one matters.
For RevOps, Finance, and Sales Compensation teams: Sales productivity reaches beyond sales activity. It also covers payout accuracy and incentive alignment. Use these benchmarks to see where selling time, quota design, or commission workflows create friction.
Why compensation visibility is part of sales productivity
Sales productivity goes past giving reps more hours each day. It also means every rep knows which deals and behaviors matter most. When compensation plans stay unclear or payout calculations lag, reps lose time chasing answers instead of revenue. That is why modern revenue teams treat commission automation and real-time earnings visibility as core productivity levers.
What Is Sales Productivity & Why Does It Matter
Sales productivity measures how well sales teams convert time and effort into revenue. It reflects how well reps prioritize the right accounts and progress deals through the pipeline. Strong productivity holds momentum from first touchpoint to close.
Sales productivity statistics show how teams perform and where efficiency drops. These statistics track selling time and win rates. They also measure pipeline coverage and activity volume.
They reveal performance gaps and benchmark teams against industry standards. The data guides leaders toward actions that improve output. It also supports forecasting and diagnoses bottlenecks. The same data highlights productivity shifts across 2024 and 2025 driven by AI and automation.
Sales leaders track productivity because it acts as an early warning system. Measured well, it reveals where deals stall and which activities create the most impact. It also flags internal processes that create blockers. Productivity data helps teams benchmark performance and understand rep capacity. It surfaces coaching opportunities that influence revenue.
Productivity matters more now because selling has grown more complex. Buyers expect personalized interactions, and cycles run longer. Sales teams must work across multiple channels and decision-makers. Tools and AI are also changing how reps work and what efficient selling looks like.
When leaders track selling time and pipeline progress together, they see where productivity leaks. That view points to the process or compensation changes that move revenue. Such clarity helps revenue leaders allocate resources and design stronger processes. The result is teams that convert effort into predictable growth.
Key Sales Statistics & Trends for 2026 (Core Insights)
Economic pressure and longer buying journeys now define sales productivity in 2026. AI-led selling adds a third force. The data shows a clear pattern: reps work harder, while deal conversion and quota attainment keep falling.
These trends explain why revenue teams invest in automation and compensation workflows that keep reps focused on revenue work.
1. Quota attainment is under pressure – and highly uneven
- In the 2024 B2B Sales Benchmarks Report (Ebsta x Pavilion), 69% of reps fell short of quota as of early 2024. Only 15% of sales teams had more than half their reps hitting at least 80% of quota.
- According to Salesforce's 2024 State of Sales report, 83% of sales teams that use AI technologies report revenue growth, highlighting how automation and insights can help address productivity and quota attainment challenges.
- Ebsta analysis shows skewed performance: 17% of reps generate 81% of revenue. Turnover climbed from 22% to 36%, underlining burnout and the "hero rep" problem.
What this means: If more than half your team misses quota, review more than rep activity. Examine territory design, plan complexity, and quota fairness. Check accelerator structure and pipeline quality. Confirm reps can see how performance translates into earnings.
Compensation lens: Quota attainment works as a sales performance metric and a compensation design signal. If most reps miss quota, leaders should examine whether territories and accelerators reinforce the right behaviors. Review SPIFFs, attainment thresholds, and payout timing too.
2. Win rates and deal cycles show a slower, more selective buyer
- Ebsta's 2024 report finds win rates fell 18% versus 2022 and 27% versus 2021. Sales cycles grew 16% in H1 2023 and 38% versus 2021 before stabilizing late in the year.
- At the same time, average deal values decreased 21%, driven by tighter budgets and more scrutiny on spend.
- A HubSpot sales survey reported an average sales win rate of 28%, which has become a widely cited benchmark for B2B teams.
What this means: Even healthy-looking pipelines now produce deals that are harder to win and slower to close. Average deal size is shrinking too. Productivity now hinges on opportunity quality and velocity, not raw volume.
3. Time spent selling remains the biggest productivity drain
- Salesforce's State of Sales, 6th Edition finds reps spend 70% of their time on non-selling tasks and 30% selling. Admin work and manual data entry eat much of the week.
- According to AbstraktMG, sales reps spend only 35–39% of their time on direct selling activities, with the rest devoted to prospecting, administrative tasks, and internal meetings, highlighting a major productivity challenge.
What this means: The single most important productivity "stat" to track is how much time reps spend in real selling conversations. Teams that free up even 10–15 percentage points of time see outsized performance gains.
For RevOps and Sales Compensation teams: This productivity loss shows up in several ways. Compensation disputes and delayed commission statements pile up, alongside manual spreadsheet checks. Reps keep asking, "How much will I earn if this deal closes?" When incentive data stays unclear, reps lose focus. When payouts are automated and visible in real time, compensation becomes a productivity lever instead of an administrative burden.
4. AI and advanced tools are now a core productivity driver
- Salesforce reports 81% of sales teams invest in AI. Four in five already experiment with or fully implement AI in their workflows.
- Among AI-using teams, 83% saw revenue growth last year, compared with 66% of teams without AI. AI-enabled teams are pulling ahead.
- Gartner's 2024 seller survey finds reps who partner well with AI tools are 3.7× more likely to meet quota than those who do not.
- McKinsey estimates generative AI could add $0.8 to $1.2 trillion in productivity across sales and marketing, on top of gains from traditional analytics.
What this means: AI has moved past the "nice to have" experiment stage. The gap between AI-enabled and non-AI teams now shows in revenue growth and quota attainment.
5. Seller sentiment and pipeline quality are cautiously optimistic
- HubSpot's 2025 State of Sales finds 91% of sellers say win and close rates rose or stayed flat over 12 months. Another 93% report deal sizes held or grew, and 68% saw better lead quality.
- Still, 51% of sellers hit 75% or less of quota in 2024, and only 24% met or beat quota. Even so, 60% expect to reach at least 76% of quota in 2025. Optimism holds despite recent shortfalls.
- Large enterprises like Dell are restructuring sales compensation in 2026 to link pay more tightly to quota performance, signaling ongoing pressure on attainment and the need for clearer performance incentives.
What this means: Teams stay bullish about the future while they lag today. Investment flows into enablement and AI to turn a better pipeline into consistent quota attainment.
6. Productivity is concentrated in top performers
- Ebsta's dataset spans 4.2 million opportunities and $54 billion in revenue. It shows 17% of reps generate 81% of revenue, while 44% of deals slipped in 2023. The gap between top and average reps reached 8.9×.
- Researchers note that productivity in many organizations follows a Pareto‑like distribution, where a relatively small group of top performers contribute a large share of results, often modeled as the "80/20 rule."
What this means: The average rep and average team keep falling behind. A 2026 productivity strategy must study what top performers do differently. Then it should scale those behaviors and tech patterns across the wider team.
These benchmarks reveal where productivity leaks. Long cycles and low selling time drain output, and weak tooling makes it worse. For revenue leaders in 2026, the opportunity lies in closing the gap between effort and outcome.
Teams that benchmark performance and streamline workflows set themselves up to outperform.
Productivity and compensation move together. Use this report to benchmark how Sales Compensation teams adapt quotas and pay practices to changing seller performance in 2025 and beyond.
Global & Regional Sales Productivity Benchmarks
Sales productivity varies widely across regions and industries. Data from 2023 to 2025 shows a clear pattern: quota attainment falls while sales cycles lengthen. Productivity gaps widen across global markets.
Use these benchmarks to compare your team against market reality. They show where selling time or compensation workflows create friction.
Global Sales Productivity Trends
- Salesforce's State of Sales 2024–25 reports that only 28% of sales reps hit their annual quota, the lowest figure in six years.
- The B2B Sales Benchmarks 2024 study shows the average mid-market sales cycle lengthened to 6.2 months, with enterprise cycles stretching 7–9 months depending on deal size.
- Salesforce reports reps spend only 28% of their time selling, with admin tasks consuming nearly half the workweek.
- In Q4 2024, average global quota attainment stood at 43%, showing consistent underperformance across SaaS sales teams.
- 69% of reps missed quota in 2023, marking the third consecutive year of widespread quota shortfalls.
- According to Norwest's 2024 B2B Sales & Marketing Benchmark Report, 50% of companies report win rates in the 31–50% range after the proposal stage.
- The global ICM (incentive compensation management) market is forecasted to grow at a 16.7% CAGR to $8.97B by 2033, reflecting a global shift to productivity-focused pay models.
Industry-Specific Sales Productivity Benchmarks
- In SaaS, the median ACV for private companies is $22,357, influencing quota expectations and compensation.
- High-performing reps generate more revenue than average, which shows productivity ratios matter more than quotas alone. At scale, a healthy SaaS benchmark is $500K-$1M ARR per rep each year.
- Close rates vary by industry, but most sit near the 20% mark. Software averages 22% and finance around 19%. Biotech sits lower at 15%.
- Retail sales productivity lags other sales roles. The BLS reports retail sales workers had a median annual wage of $34,730 in May 2024, compared to the broader sales occupations median of $37,460.
Regional Sales Productivity Comparisons (U.S., U.K., Europe, Global)
- Sales reps in the U.S. Tier-1 markets (top metro areas) hold roughly a 15% OTE (on-target earnings) premium over peers in U.S. Tier-2 and UK/EU regions.
- U.S. sales reps earn 22% more on average than their European counterparts, reflecting stronger compensation tied to productivity.
- In the U.K., business sales performance surveys report productivity challenges, with less than half of reps hitting targets in 2023.
- San Francisco and New York rank among the top-paying metros, with Seattle close behind. Reps there earn 25–30% higher salaries than peers elsewhere in the U.S.
How Sales Reps Spend Their Time
How reps allocate their day shapes sales productivity, and most of that time goes to work other than selling. Recent research shows administrative workload and fragmented tech stacks keep eroding sales capacity.
The data below reveals where sellers lose the most time and what top-performing teams do differently.
Time Split — Selling vs Admin Work
- Sales reps spend only 30% of their time actively selling, with the majority spent on admin tasks and internal work.
- Gartner reports that 50% of rep time is spent on admin work, validating the scale of productivity loss.
Prospecting, Meetings & Follow-Up Efficiency
- Salespeople spend 71% of their time on non-selling tasks like prospecting and data entry.
- High-performing reps spend more time in discovery and objection handling, which correlates with 843% better outcomes.
- Sales teams that use a standardized follow-up process see a 78% higher conversion rate compared to teams without a systematic approach.
- Referencing a previous interaction or meeting in a follow-up email increases response rates by 62%.
Productivity in Remote & Hybrid Selling
- Precise data stays limited, though BLS research suggests remote and hybrid industries show little productivity difference from office-based ones. Remote sellers keep pace with in-office peers under similar conditions.
- Companies with remote-first hiring models report lower turnover and higher satisfaction, supporting long-term productivity.
- According to the 2022 State of Sales Enablement Report, effective onboarding decreases ramp-up time by 26%.
The selling-time gap runs deeper than the calendar. It is an operating-model problem. Teams need to remove manual tasks and tighten follow-up workflows. They should give reps clear visibility into the deals that improve attainment and earnings.
Teams that streamline workflows and automate repetitive tasks outperform peers. The gains show in quota attainment and faster ramp-up.
Key Metrics & Performance Benchmarks
Sales productivity comes down to how efficiently teams move deals through the pipeline and hit quota targets.
The benchmarks below show where performance improves and which metrics give the clearest picture of 2026 team output.
Win Rates and Conversion Metrics
Win rates remain one of the clearest indicators of sales productivity, and industry data shows most teams still struggle with consistent conversion.
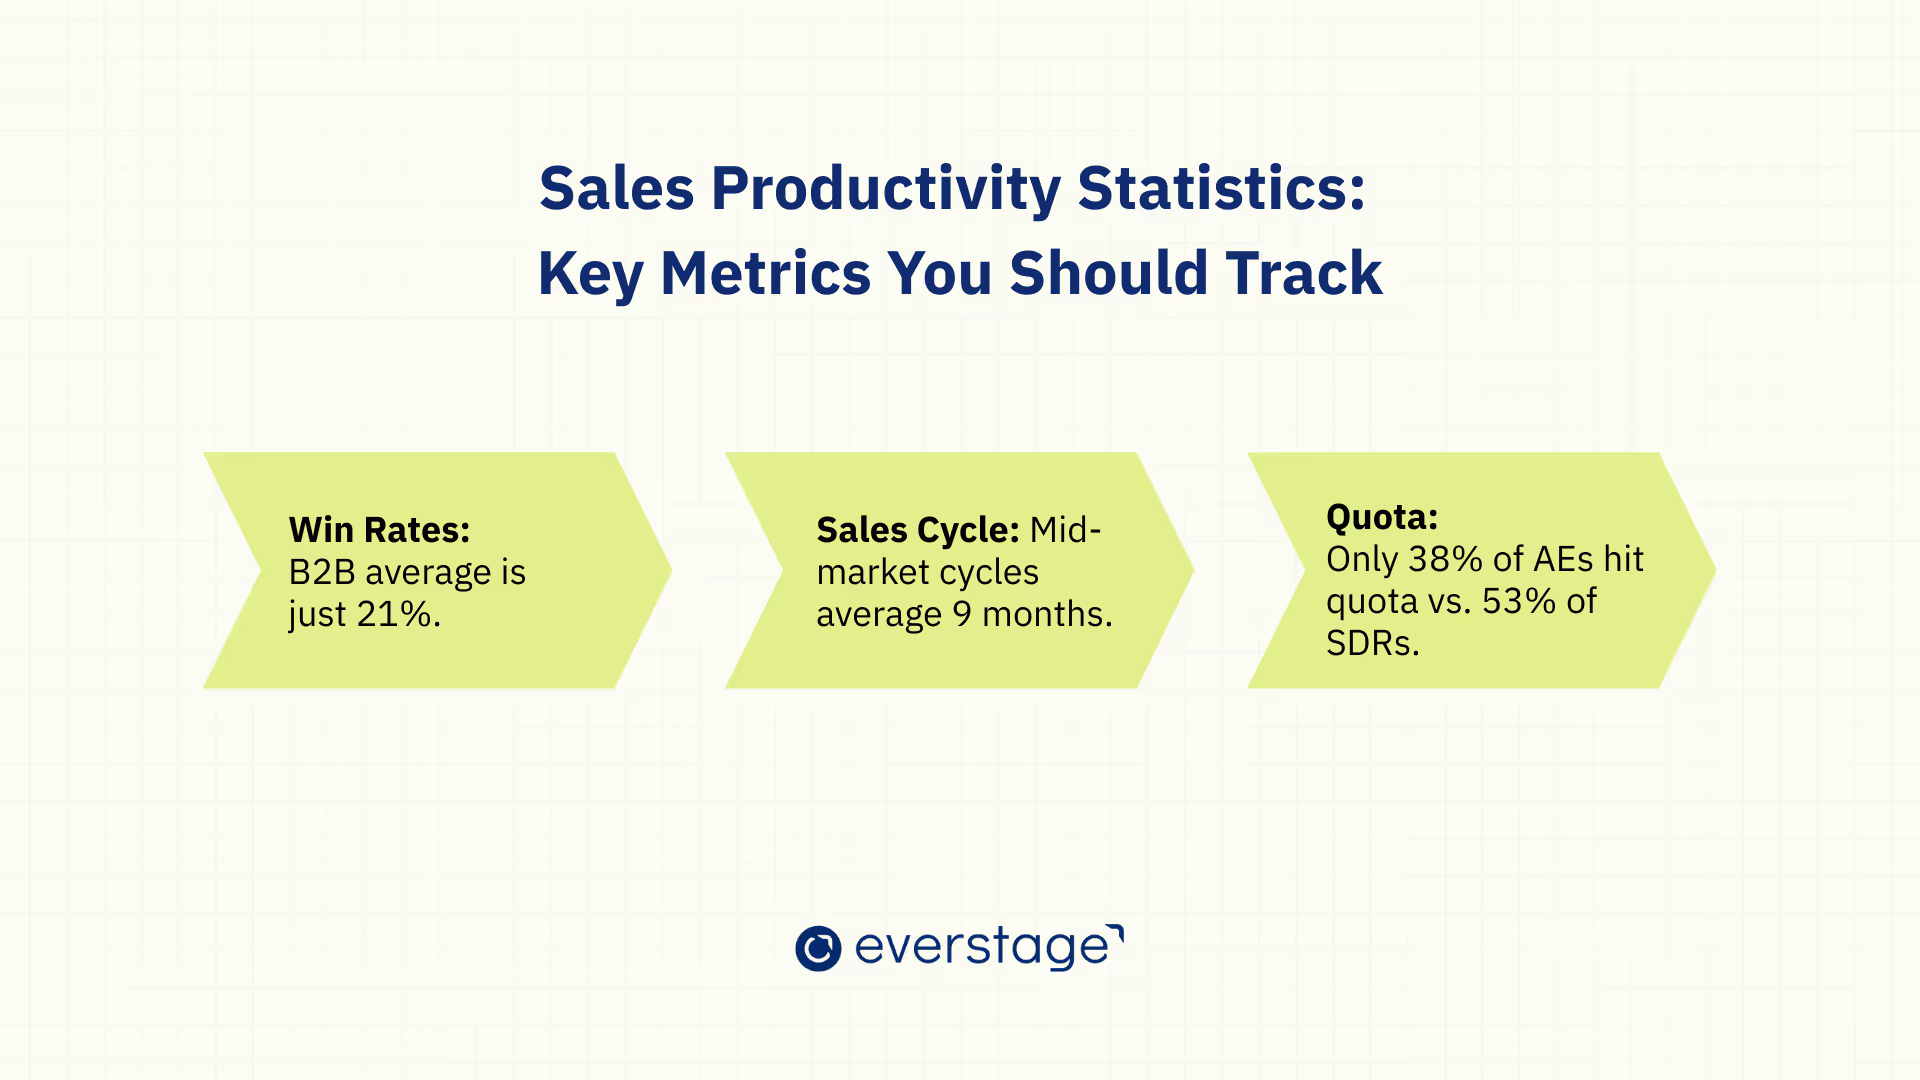
- HubSpot reports the average B2B sales win rate is just 21%, which signals persistent trouble converting opportunities into closed deals.
- Deals slipping in pipelines reached 44% in 2023, eroding forecast accuracy.
Sales Cycle Length, Touchpoints & Response Times
Longer sales cycles keep draining sales capacity, especially in mid-market and enterprise SaaS.
- Companies targeting the mid-market with average annual contract values between $50,000 and $100,000 experienced sales cycles averaging nine months.
- 58% of SaaS firms reported longer cycles in 2024, continuing multi-year lengthening trends.
- Early 2023 saw cycles lengthen by 16%. They stabilized in the second half with a 23% reduction, a sign that economic constraints eased.
- Speed-to-lead stays critical. HBR found companies that respond to a lead within one hour are 7x more likely to qualify it than those that wait an hour longer.
Quota Attainment by Role and Industry
Quota attainment continues to reflect significant imbalances across sales roles and industry segments.
- Private B2B SaaS companies have a median $129,724 revenue per employee, a strong proxy for overall productivity.
- Recent research in sales revenue modeling shows that advanced uplift methods can increase incremental revenue per account by nearly 2.7× in high‑touch sales programs, underscoring how top performers and high‑impact activities drive outsized productivity.
- A 2025 Boston Consulting Group (BCG) study of over 1,250 companies found that only about 5% are realizing measurable value from their AI investments, including productivity and revenue impact, while 60% see little to no benefit.
Across roles, these benchmarks tell one story. Rising quota expectations meet slowing buying cycles, and the productivity gap widens. Teams must respond with better enablement and performance visibility.
Technology and Automation in Sales Productivity
CRM usage and AI adoption shape modern sales productivity, and enablement tools remove manual work that slows deals.
The statistics below highlight where technology delivers the highest ROI and where adoption challenges slow teams down.
CRM Usage and Productivity Gains
- Large‑scale experiments in online retail reveal that Generative AI adoption can increase sales productivity by up to ~16.3% even when prices and inputs remain constant, indicating measurable productivity improvements when AI is embedded in workflows and customer interactions.
- According to recent research, 90% of UK business leaders regularly use AI, but only 16% have integrated AI into their CRM, showing both the opportunity and adoption lag that affects sales productivity and outcomes. Early adopters that combine AI with CRM report marked improvements in sales efficiency and customer engagement.
- CRM-integrated enablement tools lift productivity by embedding training and playbooks into the seller workflow. That cuts onboarding time and closes skill gaps faster.
AI and Automation Adoption Rates
- McKinsey's 2024 Global AI Survey shows adoption in sales and marketing keeps rising, with generative AI delivering the strongest productivity improvements across customer-facing functions.
- AI-driven sales teams reduce cycle times by up to 20%, speeding opportunity closure.
- According to Phoenix Strategy Group, adopting predictive analytics can improve forecast accuracy by 30–40% compared to manual methods, giving sales teams greater confidence in their pipeline projections.
- AI adoption among sales teams is expected to handle 80% of customer interactions by 2030.
Sales Enablement Tools: ROI and Adoption Challenges
Enablement platforms now sit at the center of rep performance. They cover content management and onboarding automation.
- 54% of leaders expect AI and enablement tools to deliver 10%+ productivity gains in 2024.
- A Gartner article, "3 Top Trends for Chief Sales Officers in 2025," states that 70% of sellers feel overwhelmed by the technology needed to do their jobs.
- Everstage automates commission calculations and removes spreadsheet-based payout errors, giving reps real-time visibility into earnings. That cuts compensation admin for RevOps and Finance while sellers stay focused on revenue-driving deals. Learn more about Everstage.
As sales cycles grow more complex and stakeholder groups expand, the advantage goes to teams that invest in automation and operational precision. Sales productivity will belong to organizations that treat technology as a multiplier for the revenue engine, not a shortcut.
Buyer Behavior and Its Effect on Productivity
Buyer behavior has shifted sharply over five years, and productivity now depends on how well teams adapt. Modern buyers want speed and self-service, with personalization throughout.
They also involve more stakeholders than ever, making the sales motion longer and more complex. Here is how those shifts hit sales productivity.
Changing Buyer Preferences & Expectations
Current research shows customer behavior increasingly favors self‑service and automated solutions, with Gartner predicting that by 2029, agentic AI will autonomously resolve 80% of common customer service issues — reflecting ongoing trends in buyer‑led problem solving.
Demand for personalization keeps growing. IBM Think found 67% of customers feel frustrated when interactions miss their needs. Sellers face pressure to deliver contextual, insight-driven conversations instead of generic pitches.
Buying committees keep expanding. More stakeholders make consensus harder to build, and sales cycles stretch. Reps spend more time aligning priorities and validating business cases across departments.
Why Prospects Drop Out of the Funnel
The G2 Buyer Behavior Report 2024 notes deal velocity slows as buying cycles lengthen, raising the chance that prospects disengage mid-funnel.
Drop-off reaches past money and timelines. Buyers walk away from poor follow-up and inconsistent communication. These soft factors matter, since prospects expect proactive guidance and clear next steps. When follow-up lags, interest drops and pipeline quality falls with it.
How Buyer Behavior Shapes Sales Cycles
AI-driven personalization is changing expectations fast. Buyers respond more favorably to tailored insights, with 58% of B2B buyers saying they are more likely to buy from reps who understand their business context.
Personalization alone struggles against added complexity. Enterprise deals frequently run 9–12 months as committees grow and internal validation intensifies.
In 2024, more than half of B2B deals required 10+ touchpoints. Sales cycles now run long and multi-threaded. Each extra touchpoint raises rep workload and reduces forecast predictability.
For a framework on tackling these exact B2B-specific pressures — longer cycles, larger buying committees, more complex procurement — see our guide to B2B sales productivity, including a 90-day roadmap for closing the gap
Barriers and Challenges to Productivity
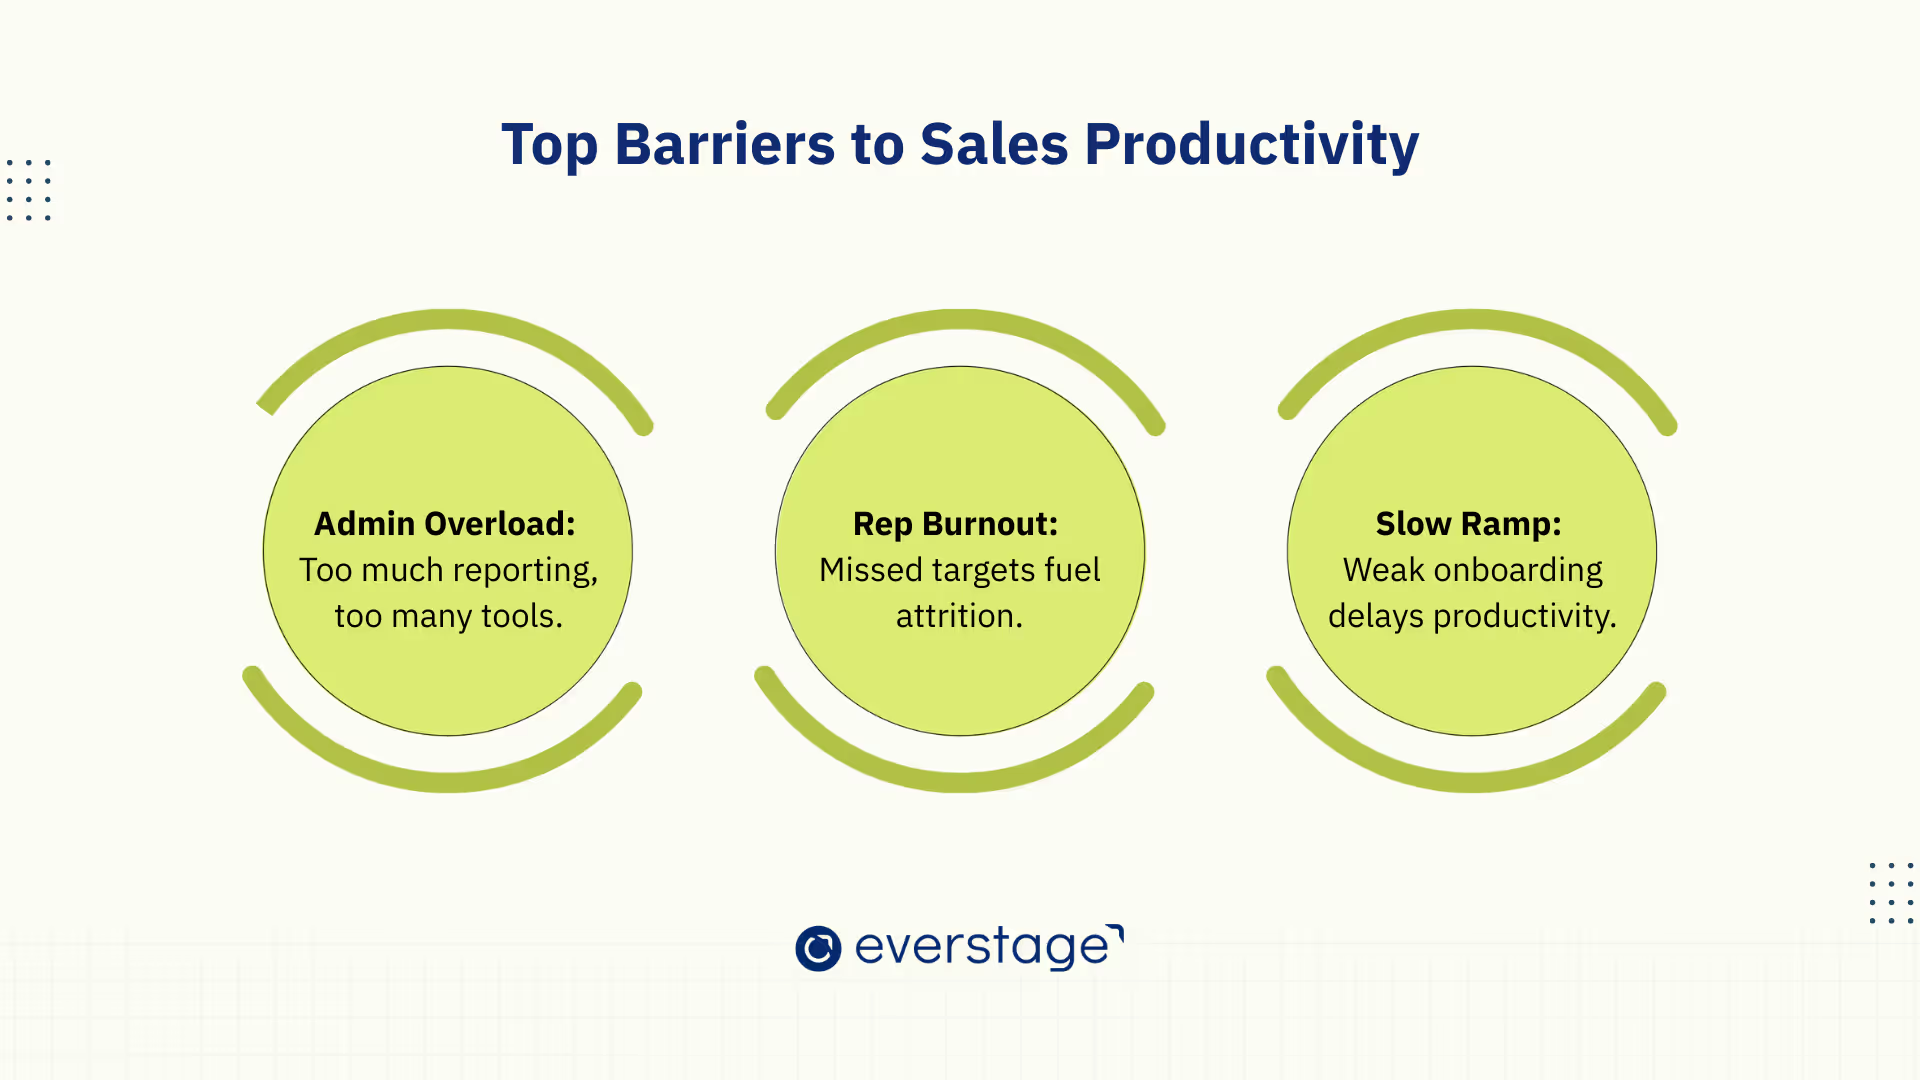
Sales productivity drops because reps fight structural blockers, not because they lack skill. From admin overload to unclear enablement, these friction points slow deals and weaken quota attainment.
1. Top Productivity Blockers (Admin, Tools, Processes)
Administrative tasks consume hours each week and pull reps away from customer conversations. Tool overload makes it worse. Gartner reports 50% of sellers feel overwhelmed by the number of platforms they must use, which creates context-switch fatigue. Poor data quality and weak tool integration delay decisions and hurt forecast accuracy.
Operational takeaway: Manual commission workflows create hidden productivity drag. Every payout dispute or unclear earnings question pulls RevOps and sellers away from revenue work.
2. Rep Burnout, Turnover & Retention
Burnout stems from constant pressure and unrealistic expectations, not the hours worked. When reps lack clarity on career growth, turnover spikes. Teams that balance territories and adjust quotas to market realities see much higher retention. Mentorship lifts it further.
3. Training, Coaching & Ramp Time
Strong onboarding cuts ramp time by giving new reps clarity and tools early. Ongoing coaching boosts performance and prevents early stagnation. Reps in structured training programs hit productivity milestones within the first 90 days more often.
These challenges are common, and they are solvable. With streamlined processes and continuous enablement, sales teams reclaim hours and drive higher performance.
Future of Sales Productivity
As buyer expectations change, sales teams shift toward a productivity model powered by AI and predictive analytics. Personalized engagement rounds it out.
The next decade will redefine how rep performance gets measured, moving from activity metrics to value-driven outcomes.
Role of AI and Personalization in the Next Decade
- AI-driven personalization will become standard practice, with reps expected to deliver hyper-relevant outreach across every touchpoint.
- Automation will eliminate low-value tasks, shifting rep focus to consultative selling and strategic account growth.
- Productivity by 2030 will hinge on customer lifetime value and revenue per rep instead of activity volume.
- Continuous learning and adaptive coaching will sit inside workflows, keeping reps current with fast-changing buyer expectations.
Predictive Analytics & Data-Driven Selling
- Predictive tools analyze historical deal data and buying signals instead of relying on guesswork. They help reps focus on the most conversion-ready leads and improve funnel efficiency.
- Analytics platforms also flag pipeline bottlenecks. They help leaders shorten cycles by recommending the highest-converting action at each buyer stage.
- Data-driven organizations build stronger long-term productivity by aligning enablement and coaching to objective metrics. That cuts rep frustration and improves retention without quota over-assignment.
Simplify Sales Processes and Align Incentives for Growth
Sales productivity is shifting fast. Reps face longer cycles, tougher buyers, and rising quota pressure. The teams that win in 2026 will remove operational friction and give reps more time to sell. They will align incentives with the behaviors that drive revenue.
These benchmarks matter for that reason. They show where teams lose momentum and how top performers manage their time. They also point to fixes in coaching and process.
Everstage helps revenue teams close that gap. It automates commission calculations and gives reps real-time visibility into earnings, with no spreadsheet chaos. With cleaner compensation data across CRM and payout workflows, leaders get a sharper view of performance while reps stay focused on the right deals.
As selling grows more complex, the winning teams simplify. They cut admin and align effort with rewards. Use these insights to refine your processes and support your reps, and you will stay competitive in the year ahead.
Book a demo with Everstage to see how it turns sales commissions into a productivity lever
Questions worth asking
The things most people want to know before they commit.
How do I calculate sales productivity for my team?
You calculate sales productivity by comparing total revenue output against the time and resources required to generate it. The formula aligns revenue per rep, selling time, and conversion rates with cycle length. The result shows whether reps convert effort into revenue efficiently and where the process needs work.
What factors decrease sales productivity in sales teams?
Sales productivity drops when reps spend limited time selling, face manual admin work, or lack clear processes. It also falls when quotas miss the mark or compensation plans stay hard to understand, sending reps to chase payout answers instead of deals. Poor lead quality, long cycles, and tool fragmentation reduce output further.
How productive are sales reps compared to industry benchmarks?
Sales reps fall below industry productivity benchmarks because most spend less than one-third of their time selling. Industry data shows reps struggle with administrative tasks, long cycle times, and low quota attainment. Comparing these benchmarks helps leaders track efficiency and prioritize improvements.
How can sales productivity statistics improve revenue performance?
Sales productivity statistics improve revenue performance by showing where reps lose selling time and which activities generate the highest conversions. These insights help leaders streamline workflows and prioritize high-value actions. They also sharpen coaching, quota design, and forecasts.
How does compensation visibility affect sales productivity?
Compensation visibility helps reps see how specific deals and behaviors affect earnings. When reps view attainment and projected commissions in real time, they spend less time chasing payout answers and more time on revenue-driving work. That cuts disputes for RevOps and Finance and keeps sellers focused on quota attainment.
How can sales productivity statistics improve revenue performance?
Sales productivity statistics improve revenue performance by revealing where reps lose selling time, how efficiently they manage pipelines, and which activities generate the highest conversions. These insights help leaders streamline workflows, prioritize high-value actions, optimize coaching, and adjust forecasts with greater accuracy.