
.avif)
TL;DR
Sales performance dashboards give sales teams real-time visibility into KPIs, helping them track progress, spot issues early, and optimise strategy for better results.
- Replace slow, static reports with interactive, automated visual dashboards
- Focus on core metrics like revenue, pipeline health, and conversion rates
- Customise views for reps, managers, and executives to boost alignment
- Use insights to forecast sales trends and improve team productivity
Introduction
Static reports tell sales teams what already went wrong. When pipeline movement, deal risk, and quota progress sit in spreadsheets or end-of-week summaries, managers catch problems after the recovery window has closed.
Gartner's 2024 survey of over 1,000 B2B sellers found that overwhelmed sellers are 45% less likely to attain quota, with 72% already feeling overwhelmed by the volume of skills and tools their role requires. Teams without real-time performance visibility compound that burden, leaving managers to catch problems only after the recovery window has closed.
A sales performance dashboard gives the team a live view of the numbers that affect revenue, such as pipeline coverage, stalled deals, quota attainment, forecast movement, and rep activity. Leaders can spot gaps while there is still time to act.
Reps know which opportunities need attention. Managers know which deals need coaching. Executives know where to shift budget, headcount, or coverage before missed targets become final.
This guide covers what a sales performance dashboard is, why it matters, and the key components that make one effective. You will also find step-by-step build instructions, templates, tool comparisons, and strategies for turning dashboard data into revenue growth.
Why Sales Performance Dashboards Matter
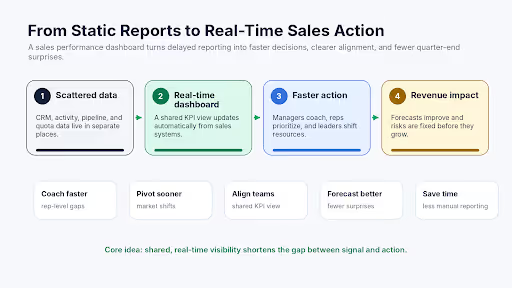
Delayed data and misaligned teams are two of the costliest problems in sales operations. A sales performance dashboard addresses both by giving every stakeholder a shared, real-time source of truth connected directly to revenue outcomes.
- Data-driven decision-making: Dashboards replace gut instinct with real-time data, enabling leaders to allocate resources and coach reps based on facts rather than recollection.
- Faster response to market shifts: When pipeline health or conversion rates change, dashboards surface these trends immediately so teams can act before small issues become major revenue gaps.
- Improved team alignment: Shared visibility into goals and progress means every stakeholder, from individual reps to the C-suite, operates from the same data.
- Higher sales productivity: Automating data collection and reporting frees up hours each week, time reps and managers can redirect toward selling and coaching.
- Stronger forecasting accuracy: Historical trend data combined with real-time pipeline metrics produces more reliable revenue forecasts, reducing quarter-end surprises.
- Measurable ROI impact: McKinsey research shows companies embedding analytics into commercial decision-making see sustained, measurable growth improvements over peers.
SaaS teams tracking MRR/ARR and manufacturing organizations managing territory-based quotas both benefit. Dashboards provide the operational backbone for consistent, predictable growth at any scale.
Gartner's The DNA of Top Sales Organizations report says that sales organizations simplifying seller roles are 4.5x more likely to be top performers. A well-designed dashboard is one of the fastest ways to reduce role complexity without reducing accountability.
As more revenue teams weave analytics into daily decisions, it helps to see where AI is already making a measurable difference.
What is a Sales Performance Dashboard?
A sales performance dashboard is a visual reporting tool that tracks and displays key sales metrics in real time. It consolidates KPIs like revenue, pipeline health, and quota attainment into interactive charts and reports, improving decision-making and boosting team productivity.
Integration with CRM and analytics tools enables automated updates and accurate forecasting. Customizable views help sales reps, managers, and executives monitor progress and align strategy for better outcomes.
Beyond displaying numbers, a sales performance dashboard serves as a central hub for your entire sales operation. Graphs, heat maps, and funnel charts make complex performance patterns easy to interpret. Consider these examples:
- Funnel charts show how leads progress through each stage of the sales cycle, highlighting drop-offs and conversion bottlenecks.
- Pipeline visualizations map open opportunities by stage, deal size, or territory, making it clear where deals are stalling or which reps need support.
- Sales-specific charts like leaderboards and quota attainment gauges give quick visibility into both individual and team performance.
A sales manager can instantly spot which deals are at risk. Executives can see high-level trends such as quarterly revenue growth or changes in customer acquisition costs (CAC) over time. Each stakeholder gains tailored insights from the same underlying data.
Key Components of an Effective Sales Performance Dashboard
Real-time metrics and role-based views separate high-performing dashboards from static report replacements. The most effective dashboards share a set of core components that ensure clarity and actionability:
Core components of an effective sales performance dashboard, including what each does and why it matters.
When these components work in concert, your dashboard becomes the operating system for your sales team.
Types of Dashboards
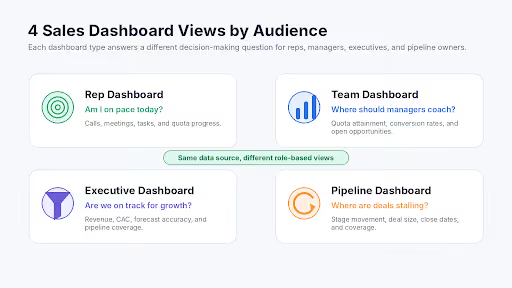
What a dashboard shows depends on who uses it. A sales rep's daily view will look different from what an executive needs to see at quarter-end.
Broadly, four main types serve distinct audiences:
1. Rep Dashboards
Designed for individual performance tracking, rep dashboards keep salespeople focused on personal targets and day-to-day activities. They typically show metrics like calls made, meetings booked, and deals closed.
A rep can instantly see whether they are on pace to hit their monthly quota or need to increase outreach volume. These dashboards maintain accountability and motivation throughout the sales cycle.
2. Team Dashboards
Team dashboards give managers a collective view of performance across their sales team. Common metrics include quota attainment, pipeline coverage, and conversion rates. A team dashboard can reveal which product lines are selling fastest or where in the pipeline deals are stalling. Managers use these insights to coach underperforming reps and recognize top achievers.
3. Executive Dashboards
At the highest level, executive dashboards offer a strategic, business-wide perspective. They focus on big-picture metrics such as total revenue, forecast accuracy, and customer acquisition cost (CAC). Executives use these dashboards to assess overall sales health and make data-backed investment decisions.
4. Pipeline Dashboards
Pipeline dashboards visualize deal progression and sales forecasting. They track open opportunities by stage, deal size, and expected close date, giving teams a clear picture of pipeline health.
These dashboards are particularly valuable for identifying bottlenecks and ensuring enough pipeline coverage to hit quotas.
Managers can quickly see if deals are concentrated at early stages or if high-value opportunities risk slipping. Pipeline dashboards help sales managers and executives align strategy with real-time sales momentum.
How to Create a Sales Performance Dashboard: A Step-by-Step Guide
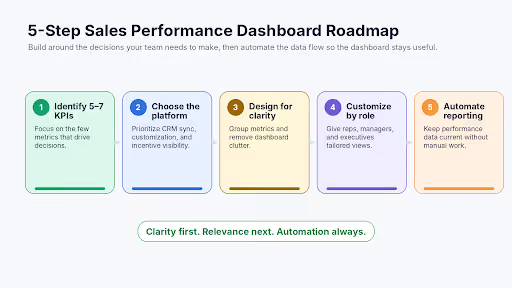
Building a sales performance dashboard requires more than plugging numbers into charts. The dashboard needs to deliver clarity, speed, and actionable insights to every user. Here is a step-by-step approach.
Step 1: Identify key metrics
Selecting the right 5–7 KPIs prevents dashboard clutter and keeps attention on the metrics driving decisions. An overcrowded dashboard makes it harder to spot important trends, not easier.
McKinsey recommends a focused dashboard highlighting the few KPIs steering action, so leaders can run performance reviews from the same facts, faster.
Metrics typically fall into five categories:
- Revenue metrics: total revenue, revenue growth rate, win rate. Subscription-driven businesses should add monthly recurring revenue (MRR) and annual recurring revenue (ARR).
- Activity metrics: calls made, emails sent, meetings booked, demos delivered.
- Conversion metrics: lead-to-opportunity rate, quote-to-close rate, average response time.
- Customer metrics: customer acquisition cost (CAC), average deal size, and quota attainment.
- Pipeline metrics: pipeline value, open deals, sales cycle length.
Choosing the right mix ensures you monitor both short-term activities and long-term growth indicators.
Step 2: Choose the right tools and platforms
Your dashboard is only as strong as the technology behind it. Pick a platform connecting directly to your CRM so updates happen automatically and visualization options make data easy to interpret.
Everstage is a sales performance management platform purpose-built for incentive-driven teams. Key capabilities:
- CRM integration: Connects directly with your CRM, sales tools, and incentive compensation systems for real-time, accurate insights, with no manual data pulls.
- Customizable dashboards: Tailor views to track KPIs like revenue growth, pipeline coverage, and win rates.
- Role-specific visibility: Leaders monitor team-wide performance. Reps see how their activities link to commissions.
- Automated data syncing: Reduces manual errors and ensures metrics are always current.
- Advanced filtering and goal tracking: Focuses attention on the metrics driving results.
- Incentive-linked analytics: Connects real-time sales metrics directly with incentive tracking, keeping teams motivated by showing progress toward their earning potential.
Everstage combines real-time tracking with incentive-driven motivation, helping sales teams stay aligned and consistently on target. For a deeper look at how compensation data and performance visibility connect, see the Everstage guide to turning incentives into revenue.
If you'd rather start from a structured framework before committing to a platform, this ready-to-use template can get your comp plans off the ground quickly.
Step 3: Design a dashboard people will actually use
Cluttered layouts and excessive data points are the two fastest paths to dashboard fatigue. A dashboard's value lies in how quickly users can interpret and act on the data.
- Keep the view focused on the KPIs driving decisions, not every metric available.
- Group related metrics together: all activity metrics (calls, meetings) in one section, all revenue metrics (pipeline value, closed deals) in another.
- Use charts, heat maps, and trendlines to make patterns visible at a glance without requiring deep analysis.
- Decide which metrics users should see daily (activities completed), weekly (pipeline growth), or monthly (revenue trends). Frequency-based layering keeps attention on actionable insights.
Step 4: Customize for your team's needs
Role-based filters and permission layers ensure each stakeholder gets relevant insights without information overload.
- Sales representatives focus on personal KPIs like quota attainment, upcoming tasks, and deal progression to stay on track.
- Managers track collective sales team performance, compare rep metrics, and spot areas for coaching.
- Executives access business-wide KPIs such as total revenue, forecast accuracy, and customer acquisition cost to guide strategic decisions.
Role-based access also improves speed, since users only see what matters to them.
Step 5: Automate data collection and reporting
Manual reporting is slow, error-prone, and usually outdated by the time it reaches stakeholders. Automation ensures accuracy and speed.
- Connect your CRM or BI tools (like Salesforce or HubSpot) to your dashboard platform for live updates.
- Schedule weekly or monthly reports to be automatically generated and sent to stakeholders.
- Use APIs and connectors to integrate dashboards with specialized tools for continuous syncing.
With Everstage, performance tracking links directly to incentive compensation plans. Reps see their live metrics and understand in real time how performance impacts their earnings. Leaders gain a unified view of productivity and revenue progress.
McKinsey’s 2024 report suggests that generative AI in sales delivers up to 20% productivity gains. Dashboard automation is the first layer of those gains, eliminating the manual data gathering eating rep and manager time before analysis even starts.
Sales Dashboard Templates and Examples
Activity monitoring and compensation tracking are two of the most common starting points for dashboard design. Here are five practical use cases, along with example setups and template suggestions.
Use Case 1: Daily Sales Activity Monitoring
An activity dashboard gives you a real-time pulse on outreach volume and rep engagement across channels.
What it tracks:
- Calls made, emails sent, meetings booked, and tasks completed.
Who uses it:
- SDRs, BDRs, and sales managers who need to track activity targets daily.
How to set it up:
- Create a grid view showing each rep's daily activity count.
- Add quick filters to switch between individual and team views.
- Use real-time refresh for instant updates.
Pro tip: If you run multiple outreach channels, color-code each activity type for easy differentiation.
Template suggestions: Everstage, Google Data Studio, Geckoboard.
Use Case 2: Sales Trends and Forecasting
A trends and forecasting dashboard highlights patterns in MRR/ARR growth and compares forecast vs. actual sales over time.
What it tracks:
- MRR/ARR growth, forecast vs. actual sales, and average deal sizes.
Who uses it:
- Sales leaders, RevOps, and finance teams.
How to set it up:
- Use trendline graphs to track revenue growth over time.
- Add bar charts comparing forecasted vs. actual sales.
- Break data down by product line or territory to spot hidden patterns.
Pro tip: Include historical data for at least 6–12 months to avoid misleading short-term spikes.
Template suggestions: Tableau, Everstage, Looker Studio.
Use Case 3: Team Performance Management
A performance dashboard surfaces top performers and reps who need coaching, keeping everyone accountable to shared targets.
What it tracks:
- Quota attainment %, deal conversion rates, and number of open opportunities.
Who uses it:
- Sales managers and team leads.
How to set it up:
- Add a leaderboard ranking reps by quota attainment.
- Use color-coded KPIs (green = exceeding targets, yellow = at risk, red = underperforming).
- Include drill-down views into individual pipelines to diagnose bottlenecks.
Pro tip: Compare performance month-over-month to separate consistent achievers from one-off successes.
Template suggestions: HubSpot dashboards, Google Sheets, and Everstage for quick builds.
Use Case 4: Executive-Level Reporting
When presenting to leadership or the board, keep the view high-level and strategic with 6–8 key KPIs on a single page.
What it tracks:
- Total revenue, CAC, CLTV, churn rate, and pipeline coverage %.
Who uses it:
- Executives, founders, and board members.
How to set it up:
- Create a one-page executive summary with 6–8 key KPIs.
- Add charts showing pipeline stage distribution and YoY growth.
- Tie each metric to a business outcome (e.g., ROI, profitability).
Pro tip: Each chart should answer a decision-making question like "Are we on track to hit quarterly goals?"
Template suggestions: Google Data Studio, Tableau.
Use Case 5: Compensation & Incentive Tracking
Earnings visibility and commission clarity are two of the strongest motivators for sales reps. A compensation dashboard delivers both.
What it tracks:
- Revenue and deal volume by territory or region.
- Quota attainment across different sales teams or geographies.
- Pipeline coverage and progression within each territory.
- Customer acquisition cost (CAC) variations across regions or channels.
Who uses it:
- Sales reps tracking earnings and managers ensuring fair payouts.
How to set it up:
- Show YTD commissions vs. targets with clear progress bars.
- Add gamified elements like "milestone achieved" visuals.
- Display historical payout trends to identify earning patterns.
Pro tip: Link commission data directly to deals so reps can see the financial impact of each win.
Understanding how well-structured incentives fuel motivation can make these compensation dashboards far more effective.
Comparing Sales Dashboard Tools and Platforms
CRM integration depth and incentive tracking capability are two factors that separate adequate tools from high-impact ones. A well-chosen platform centralizes your KPIs, ensures data accuracy, and provides role-specific insights.
Below is a comparison of the most effective tools, followed by detailed breakdowns of each.
Side-by-side comparison of five sales dashboard tools by use case, incentive tracking, CRM integration, customization, and pricing.
Tool 1: Everstage
Everstage delivers real-time visibility into sales KPIs such as revenue, pipeline coverage, and quota attainment, with funnel charts and pipeline dashboards making complex performance data easy to interpret. Drill-down analytics highlight bottlenecks and forecast accuracy, helping leaders make smarter, data-backed decisions.
The major differentiator is incentive visibility. Everstage connects performance insights directly with compensation tracking, showing reps how their activities translate into earnings. The platform syncs live with Salesforce, HubSpot, and other sales systems to ensure data accuracy and real-time updates.
Key capabilities at a glance:
- No-code plan designer: Build and deploy complex compensation plans — tiered rates, accelerators, SPIFs, team splits, multi-currency, draws — without involving engineering. Plans can be updated mid-cycle as business conditions change, with changes pushed to payees automatically.
- Automated commission calculations: Every payout cycle runs on automated, auditable calculations. Finance gets full traceability; reps get accurate numbers on time. The engine also supports ASC-606-compliant expense amortization for organizations requiring revenue recognition compliance.
- Real-time rep dashboards: Reps see live earnings, attainment progress, and payout projections without filing a ticket or waiting for month-end statements. Fewer "where is my commission?" queries. More time selling.
- Reporting and analytics: Drill into performance from team-level quota attainment down to individual deal contribution. Leaders can identify which reps are on track, which comp plans are driving the right behaviors, and where payouts are at risk before the cycle closes.
- Structured approvals and dispute management: Every override, exception, and adjustment goes through a tracked approval workflow. Finance and HR get a clean audit trail. Reps get a formal channel to flag discrepancies rather than arguing over spreadsheets.
- Native CRM and ERP integrations: Bi-directional syncs with Salesforce, HubSpot, NetSuite, Workday, and others pull live deal data into commission calculations without manual imports. Where no native connector exists, open API and CSV options are available.
- Territory and quota planning: The Planning module manages territory design, quota distribution, and capacity modeling on the same platform as incentive tracking, so comp plans and coverage decisions stay aligned rather than drifting apart in separate tools.
- AI-powered anomaly detection: Everstage's agentic intelligence layer flags payout risks, detects calculation anomalies, and surfaces recommendations before errors compound across a pay cycle.
Tool 2: Geckoboard
Geckoboard is ideal for small teams needing quick setup and real-time visibility without complex configurations. A drag-and-drop interface means non-technical team members can build and edit dashboards easily. The platform connects with Google Sheets, Salesforce, and many other data sources, and works particularly well for keeping activity metrics visible on sales floors or in remote team hubs.
Tool 3: Tableau
Tableau is designed for data-heavy organizations requiring deep analytics and custom reporting. Advanced capabilities include SQL queries, calculated fields, and interactive visualizations for complex sales datasets. The setup requires more training but pays off with highly flexible, powerful insights. Tableau is most valuable for executives and RevOps teams analyzing multi-year performance patterns.
Tool 4: Google Data Studio
Google Data Studio is accessible for startups and small teams without large software budgets, integrating natively with Google Sheets, Google Analytics, and BigQuery, plus most CRMs. Pre-built dashboard layouts make it fast to get started, and the tool suits teams wanting clean visual reports without significant technical overhead.
Tool 5: HubSpot Sales Dashboard
HubSpot Sales gives HubSpot CRM users instant access to integrated sales and marketing data. Pre-built dashboards serve both individual reps and managers, with strong visual design using graphs, charts, and color-coded performance indicators. The tool is well suited to mid-sized teams wanting marketing and sales metrics in a single view.
Choosing the right sales performance dashboard tool comes down to team size and reporting complexity. If you need deep sales insights with built-in incentive tracking, Everstage is the strongest option. Teams prioritizing budget will find Google Data Studio or Geckoboard are solid alternatives. The goal is a tool helping you make faster, better sales decisions.
How to Use Sales Performance Dashboards to Improve Sales Strategy
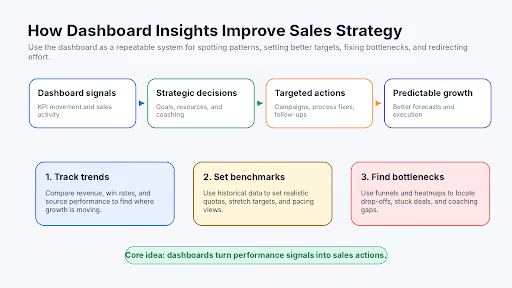
Spotting at-risk deals early and reallocating resources to high-performing channels are two immediate wins dashboards deliver. Used effectively, they ensure every sales decision is backed by data.
1. Tracking sales trends for data-driven decisions
- Monitor monthly revenue and win rates to identify shifts over time.
- Compare current and past data to spot growth patterns or potential declines before they become revenue problems.
- Pinpoint top-performing channels and products, then redirect resources from underperforming areas to high-return ones.
Example: If inbound leads from LinkedIn consistently show a 35% higher win rate than other sources, you can confidently increase LinkedIn investment.
2. Setting benchmarks and goals based on dashboard insights
- Historical trends provide the foundation for realistic sales quotas and achievable stretch targets.
- Visual progress indicators let the team know exactly where they stand in real time.
- Adjust sales goals dynamically to reflect market shifts or internal changes without losing momentum.
Example: If deal cycle times drop from 45 to 30 days, more ambitious quarterly targets become achievable without overburdening reps.
3. Identifying areas for improvement through visualization
- Funnel metrics and heatmaps locate bottlenecks in the sales journey with precision.
- These insights guide training programs and sales process changes where they will have the greatest impact.
- Everstage Reporting and Analytics lets leaders drill down into KPIs from individual rep goal tracking to pipeline health, giving teams a clear action plan rather than a long list of unanswered questions.
Example: If most drop-offs occur post-demo, the data points directly to improving objection-handling scripts or introducing tailored follow-up content.
Sales dashboards turn complex performance data into clear, actionable insights. Consistent use accelerates your ability to adapt strategy and stay ahead of targets.
For how the most successful RevOps teams connect performance data to comp design, see The State of Sales Compensation 2025.
Turning Sales Data Into Growth
A great sales dashboard functions as the operating system for your sales team. It shows where you are, highlights the best route forward, and warns you when performance drifts off course.
With the right setup, you can:
- Track what matters in real time, from revenue and quota attainment to pipeline health.
- Surface hidden opportunities, such as which reps or channels are performing best.
- Fix problems faster by identifying drop-offs and bottlenecks before they hurt your numbers.
- Plan with confidence using clear data to set targets and forecast accurately.
Start with the essentials: pick the 5–7 KPIs most important to your goals and choose a tool fitting your team's size and complexity. Refine your dashboard as your business grows. Over time, the dashboard becomes less of a reporting tool and more of a decision-making advantage.
Ready to see it in action? Book a demo with Everstage and start building dashboards that drive results.
Questions worth asking
The things most people want to know before they commit.
Which KPIs should I track in a sales performance dashboard?
Essential KPIs break down into five categories: revenue metrics (MRR, ARR, win rate), activity metrics (calls, meetings, demos), conversion metrics (lead-to-opportunity rate, quote-to-close rate), customer metrics (CAC, average deal size), and pipeline metrics (deal value, sales cycle length). Tracking 5–7 focused KPIs ensures clarity and avoids information overload. For more on how the right metrics connect to compensation design, see the Everstage KPIs guide.
How can I use a dashboard to track sales targets vs. actuals?
Dashboards compare targets with actual performance using visual indicators such as bar charts and progress trackers. Heat maps add another layer of insight by showing where performance concentrates geographically or by rep. Teams quickly see whether they are on pace to meet goals, adjust strategies, and allocate resources where they are most needed, without waiting for a quarterly review cycle.
What is the difference between a sales performance dashboard and a CRM report?
A CRM report pulls a static snapshot of data at a fixed point in time and typically requires manual generation. A sales performance dashboard aggregates data from multiple sources in real time, updates automatically, and is built for ongoing monitoring rather than one-off analysis.
CRM reports answer "what happened." A sales performance dashboard answers "what is happening now and where does it need attention." The two serve different purposes: reports are useful for post-period reviews, while dashboards drive daily and weekly decisions.
How many people should have access to a sales performance dashboard?
Access depends on role, not headcount. Reps need visibility into their own metrics and earnings. Managers need team-level views. Finance and RevOps need aggregate data for planning and payout verification. Executives need high-level KPIs stripped of individual-rep detail. A rep seeing exec-level revenue forecasts and a CFO wading through individual call logs are both getting the wrong dashboard. Role-based permissions solve this by giving each user a filtered view of exactly the data relevant to their decisions.
Can a sales performance dashboard help reduce rep turnover?
Compensation uncertainty is one of the most cited reasons reps leave. When reps cannot verify their own earnings or see how close they are to accelerators and bonuses, trust in the comp plan erodes. A sales performance dashboard with live incentive visibility removes this uncertainty by showing reps their real-time attainment, projected payout, and earnings trajectory.
Reps who can see exactly how their activity translates into take-home pay tend to stay more engaged and are less likely to attribute payout discrepancies to error. Platforms like Everstage connect performance data directly to commission tracking so reps never have to guess.